- → Databox is built for in-house marketing and ops teams that want one screen for all their KPIs — it's not trying to be Tableau, and it shouldn't be
- → 130+ native integrations with one-click OAuth — setup is genuinely fast compared to tools that require manual connector configuration
- → Unlimited users on every paid plan — rare in this category, and it means the real cost driver is data source count, not headcount
- → AI summaries exist but are gated behind the Growth plan ($399/mo) — Whatagraph includes AI on all plans
- → The free plan is gone (killed July 2025), which stings — you're now looking at $159/mo minimum, with each extra data source adding $7/mo
- → Rated 4.4/5 on G2 from 193 reviews, though recent sentiment on customer support has shifted noticeably downward from its earlier reputation
What Databox Actually Does (and Why It Grew So Fast)
Databox was founded in 2012 by Andrej Zitnik, Davorin Gabrovec, and Vlada Petrovic — originally out of Ljubljana, Slovenia — with backing from Techstars and later Founder Collective. Peter Caputa IV, a former VP of Sales at HubSpot who'd built their partner program to over $100M in revenue, came on as CEO and drove the growth engine from a handful of customers to 20,000+. That HubSpot DNA shows up everywhere: Databox is unusually good at onboarding, educating users through its blog and benchmark reports, and turning free users into paying customers. Or at least it was, before they killed the free plan.
The core pitch hasn't really changed in a decade: stop opening seven browser tabs to check Google Analytics, HubSpot, Stripe, and Facebook Ads separately. Databox consolidates all of that into a single dashboard you can glance at over morning coffee — or loop on a TV screen in the office. The setup is fast. Most integrations are one-click OAuth: connect your Google Analytics account, pick the metrics, drag them into a layout, done. No API keys, no code, no data engineering.
And look, I keep circling back to this when comparing Databox to everything else in this space: it occupies a genuinely unique position. It's not an agency reporting tool like Whatagraph — there's no deep white-labeling or multi-client delivery automation. It's not a full BI suite like Tableau or Looker — there's no SQL modeling or complex data warehouse integration. What it is is the fastest path from "I have data scattered across 12 platforms" to "I can see how the business is doing right now." That middle ground is exactly where most growing companies live.
One thing I've gone back and forth on: whether Databox is genuinely "easy" or just "easy for people who already think in KPIs." If your team doesn't already have defined metrics — if you're not sure which numbers to track — Databox gives you a beautiful container but doesn't tell you what to put in it. The 300+ templates help with this, but templates are starting points, not strategy. This is a tool for teams that know what matters and need a faster way to see it. If you're still figuring out your measurement framework, the tool won't build it for you.
Features That Separate Databox From the Pack
Goals, Forecasting, and Benchmark — the "DIY BI" Stack
Since May 2025, Databox has been pushing hard into what they call "DIY BI" — Datasets (a no-code SQL builder), multidimensional metrics, and drill-downs that work without a consultant to configure them. On top of that, the Goals feature lets you set targets per metric, track progress in real time, and model future performance with the Forecast tool.
The Benchmark feature is genuinely clever: it anonymously aggregates data from Databox's 20,000+ customers and lets you compare your metrics against companies of similar size and industry. "Is our 2.3% email open rate good?" becomes an answerable question instead of a gut check. I haven't seen another tool in this category do this well.
130+ Integrations with One-Click Setup
The connector library covers the major marketing, sales, finance, and operations tools: GA4, HubSpot, Salesforce, Google Ads, Facebook Ads, LinkedIn Ads, Shopify, Stripe, QuickBooks, Xero, and SQL databases. Custom data can be pushed via API or Google Sheets. Setup is genuinely one-click OAuth for most platforms — you're not configuring API keys or debugging connector scripts like you might with Looker Studio third-party connectors.
Actually, I should qualify that — the 130+ count includes some integrations that are more "technically available" than "production-ready." A few Capterra reviewers have flagged missing obscure integrations, and connectors occasionally break when the source platform updates its API. The mainstream platforms (Google, Meta, HubSpot, Shopify) are rock-solid. Niche tools? Your mileage may vary.

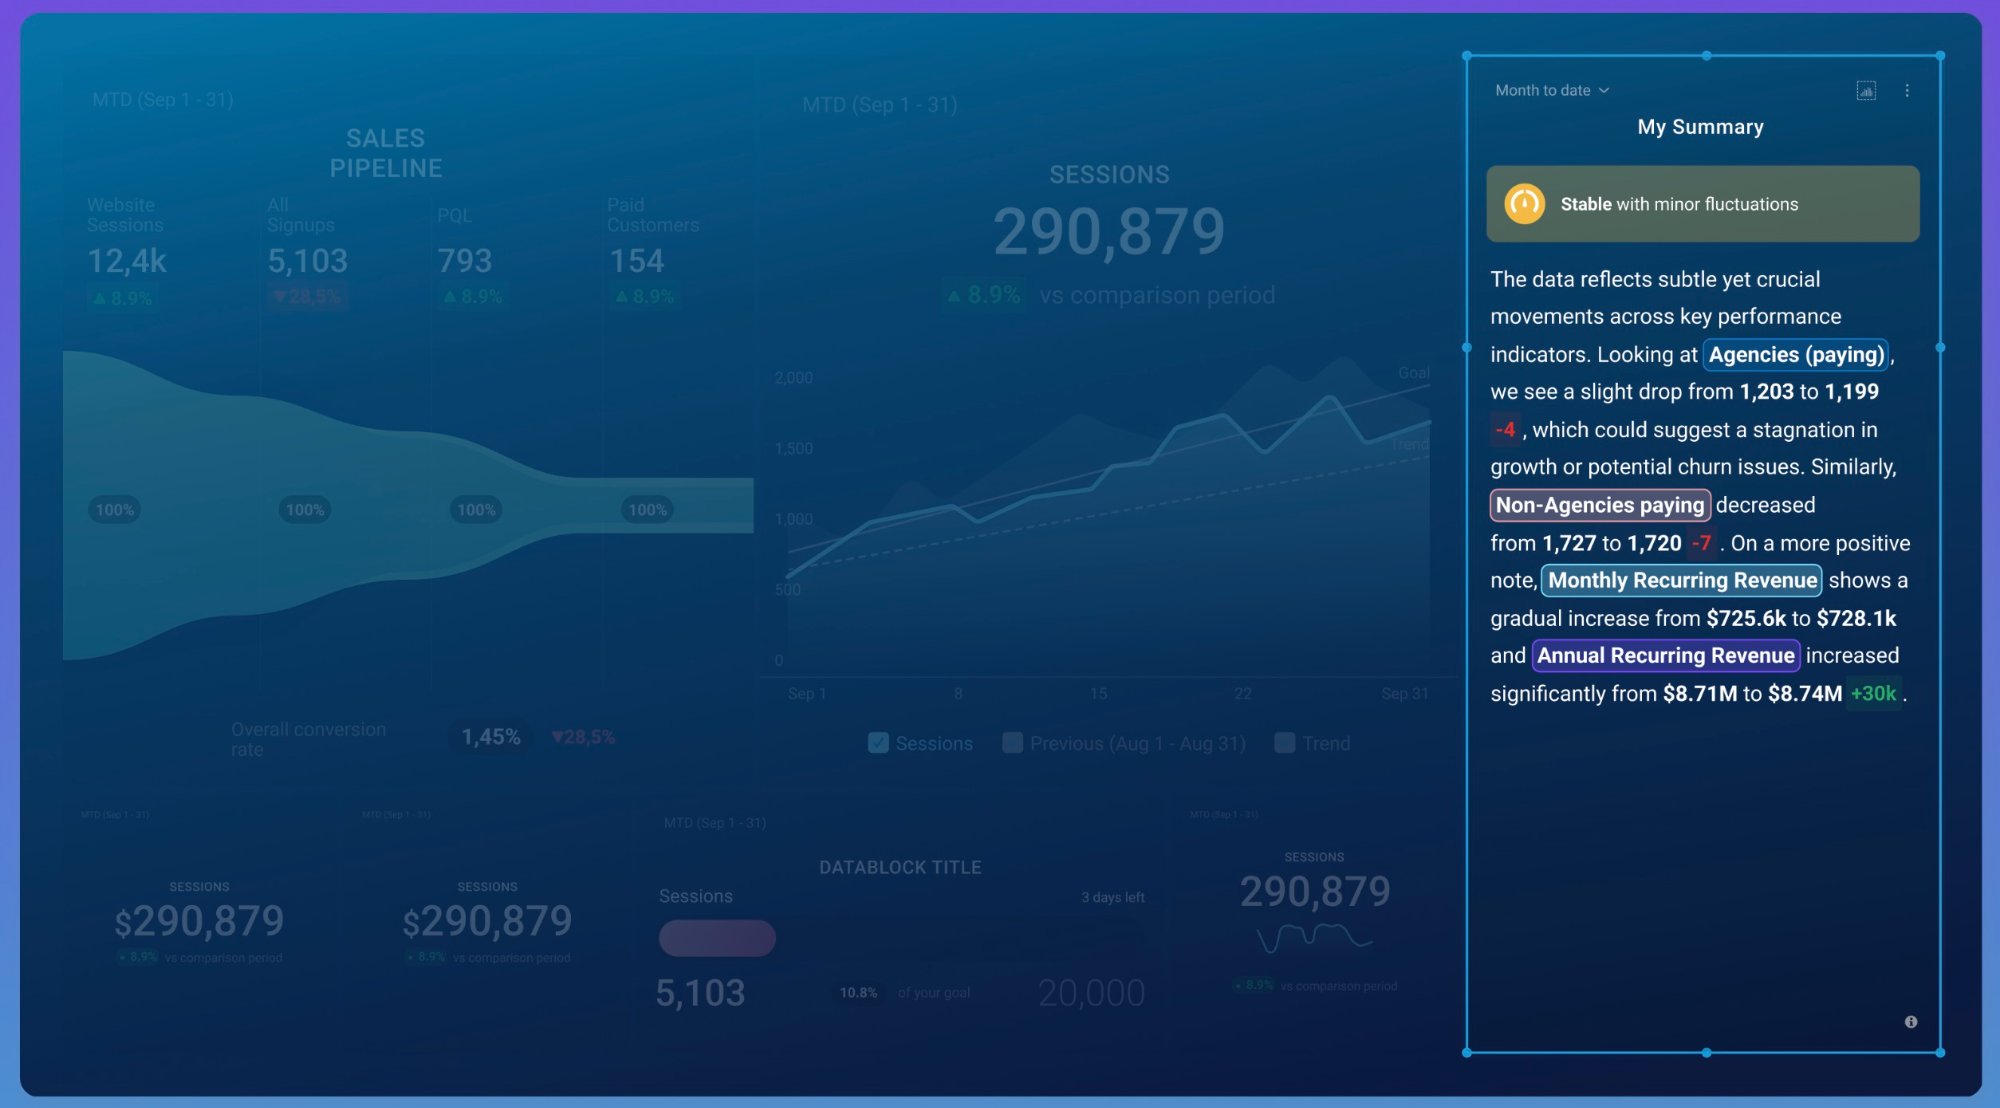
AI Performance Summaries (Growth Plan Only)
Databox's AI generates plain-language performance narratives alongside your dashboards — the kind of "here's what happened this week and what it means" commentary that usually takes a human analyst 30 minutes to write. The AI can also surface anomalies and flag metrics that are trending off-track.
Here's what bugs me about the implementation: it's locked behind the Growth plan at $399/month. And even then, there are usage caps — agency accounts get 6,000 summaries monthly, 800 daily per account, and 100 daily per user. Hit your limit? You're locked out until the counter resets. Contrast this with Whatagraph, which ships AI summaries and an AI chatbot on every plan with no per-summary caps. I understand monetizing AI features, but gating them behind a tier that's 2.5x the base price feels like it undercuts one of the product's most compelling differentiators.
Mobile Apps and Looped Dashboards
Databox has native iOS and Android apps — plus an Apple Watch app, which is a niche flex but actually useful for CEOs who want to glance at revenue during a walk. The looped dashboard feature lets you cycle through multiple boards on a shared TV screen, which is great for office environments where everyone passing by the marketing corner should be able to see how the week is going.
The mobile experience is a genuine differentiator. Most dashboard tools have web apps that technically work on mobile but feel cramped and clunky. Databox's mobile app is purpose-built, with push notifications for metric alerts and a layout that actually makes sense on a phone screen. It's one of those features that sounds minor until you realize you're checking it at 7am before the team standup.
Where Databox Falls Short (Real Talk)
The Free Plan is Dead
Databox sunset its free plan on July 1, 2025. This was a genuinely popular entry point — connect 3 data sources, build 3 dashboards, see if the tool clicks. It's gone now, replaced by a 14-day trial of the Growth plan. After the trial ends, you're paying $159/month minimum or you lose access entirely.
I get why they did it (simplify the plan structure, reduce support load from non-paying users), but it hurts the product's accessibility story. The free plan was how a lot of small teams discovered Databox was better than their spreadsheet habit. Now the discovery path costs money from day one.
Per-Data-Source Pricing Adds Up Fast
Every plan includes a base number of data sources (Professional includes ~11, Growth more). Every additional source costs $7/month ($5.60 on annual billing). Here's the math that trips people up: each account or property within a connector counts separately. Three GA4 properties + two HubSpot portals + Google Ads + Facebook Ads = 7 data sources. Add Shopify, Stripe, and LinkedIn? You're at 10 and climbing.
"Very expensive for what you get. Simple dashboards and very hard to customize."Verified Capterra reviewer (2025)
For a small team connecting 6–8 sources, it's manageable. For an agency managing 15 clients with multiple platforms each? The per-source model makes Databox prohibitively expensive compared to tools with flat pricing.
Customer Support Has Slipped
This is the one that bothers me most, because Databox used to be praised universally for support. In 2023 and early 2024, reviewers consistently called it fast, helpful, responsive. By mid-2025, a different pattern emerged. Multiple G2 reviewers describe unanswered chats sitting for 24+ hours, slow fixes for broken connectors, and a general feeling that support quality has degraded as the company scaled.
One G2 reviewer described it bluntly: the company went from "the best support out there" to "radio silence" over the course of a few months. A Capterra reviewer who tested the platform for two years with agency clients eventually left, describing a pattern of templates breaking, metrics stopping, and support blaming the client before eventually acknowledging the issue was on their end. That's anecdotal, but the pattern across multiple recent reviews is hard to ignore.
AI Features Gated Behind the Wrong Tier
Repeating this because it matters: AI Performance Summaries require the Growth plan ($399/mo). If you're a 5-person marketing team on the Professional plan, you don't get AI. You're paying $159/month for dashboards that are essentially a better-looking version of what Looker Studio does for free. The AI is what makes Databox feel like the future of reporting — locking it behind a 2.5x price jump is a strategic misfire, in my opinion.
Databox Pricing in 2026: The Full Picture
All prices in USD. Annual billing saves ~20%. Unlimited users on every plan.
- ~11 data sources included
- Unlimited users & dashboards
- Daily data sync
- Custom metrics
- Goals tracking
- No AI summaries
- More data sources included
- Everything in Professional
- Hourly data sync
- AI Performance Summaries
- Forecasting
- Advanced Datasets
- Expanded data sources
- Everything in Growth
- 15-minute sync (select sources)
- Priority support
- White-labeling add-on
- Dedicated reporting specialist
- Sunset July 1, 2025
- Was: 3 sources, 3 dashboards
- Replaced by 14-day trial
The honest assessment: for teams that need 10 or fewer data sources and don't need AI, the Professional plan at $159/month offers decent value — especially given unlimited users. But the moment you need more sources or AI features, the jump to $399 is steep, and additional data sources at $7 each can push the real monthly cost well above the headline price.
What 400+ Real Users Say: Aggregated Review Data
What Reviewers Consistently Praise
Ease of setup is the single most common positive. Onboarding takes minutes, not days. The one-click OAuth integrations mean non-technical marketing managers can have a working dashboard inside an hour. Multiple G2 reviewers call it the smoothest onboarding of any dashboard tool they've tried.
Visual clarity gets frequent praise — dashboards look polished enough to present in board meetings or display on office TVs. The drag-and-drop builder with 300+ templates means you're not starting from scratch.
Unlimited users keeps coming up as a cost advantage. Most competitors charge per-seat, which quietly doubles or triples the bill when the whole team needs access. Databox avoids this entirely.
What Reviewers Consistently Criticize
Pricing vs. value perception is polarized — 52% of GetApp reviews that discuss pricing view it positively, but the other 48% call it expensive or inflexible. The free plan removal intensified this split.
Dashboard refresh speed is a recurring complaint. Some users report that dashboards refresh too slowly for real-time decision-making, particularly on lower-tier plans with daily sync intervals.
Support quality decline shows up prominently in 2025 reviews. Earlier reviews praised support uniformly; recent ones describe long wait times and unhelpful responses — a noticeable regression.
Databox vs. the Alternatives: A Straight Comparison
| Feature | Databox | Whatagraph | Looker Studio | Klipfolio |
|---|---|---|---|---|
| Best for | In-house teams | Agencies | Google-stack teams | Technical marketers |
| Unlimited users | ✓ All plans | ✓ All plans | ✓ | Varies by plan |
| White-labeling | Premium only ($799+) | ✓ All paid plans | ✗ | ✓ Higher tiers |
| AI features | Growth+ ($399+) | ✓ All plans | ✗ | ✗ |
| Integrations | 130+ | 55+ native | 1,050+ (via connectors) | 100+ |
| Goals & forecasting | ✓ | ✗ | ✗ | ✗ |
| Mobile app | ✓ Native iOS/Android | ✗ | ✗ | ✓ |
| Free plan | ✗ (removed Jul 2025) | 5 credits | ✓ Fully free | Free tier |
| Starting price | $159/mo | €249/mo | Free | ~$125/mo |
The positioning is pretty clear when you lay it out: Databox wins on goals/forecasting, mobile experience, and ease of setup for in-house teams. Whatagraph wins on agency-specific features (white-labeling, scheduled client delivery, AI on all plans). Looker Studio wins on price (free) and connector breadth, but demands more technical setup. And Klipfolio sits in the middle — more customizable than Databox, but with a steeper learning curve.
Who Should Actually Use Databox
It's a strong fit if:
- You're an in-house marketing or ops team that needs a centralized KPI view across multiple platforms
- Your whole team needs dashboard access — unlimited users means no per-seat cost creep
- You want goals, forecasting, and industry benchmarks in the same tool as your dashboards
- You value mobile access — the native apps are among the best in this category
- You need quick setup without IT involvement — one-click OAuth connections handle most integrations
It's probably not the right tool if:
- You're an agency needing white-labeled, scheduled client delivery — Whatagraph is built for that
- You need deep data transformation, SQL modeling, or warehouse integration — this isn't a BI tool
- You're on a tight budget with many data sources — the per-source pricing compounds fast
- AI summaries are a must-have and $399/mo isn't in your range — look at Whatagraph (AI on all plans)
- You're entirely in the Google ecosystem — Looker Studio does it free with native connectors
Recent Product Updates (2025–2026)
- DIY BI Launch (May 2025) — Datasets, no-code SQL builder, multidimensional metrics, and drill-downs for deeper analysis without a data engineer
- Free Plan Removal (July 2025) — Sunset the free tier, replaced with a 14-day Growth plan trial
- MCP Integration (2025) — Connect Databox to AI tools like ChatGPT or Claude to access metrics and trigger actions from your workflow
- AI Performance Summaries refinement — Expanded coverage and improved natural-language quality for auto-generated performance narratives
- Improved Forecast tool — Best-case and worst-case scenario modeling for any metric
- Enhanced custom metrics — More flexible formula builder with cross-source calculations on higher tiers
The DIY BI push is the most interesting move strategically — it signals that Databox is growing up from a dashboard tool into something closer to a lightweight analytics platform. Whether they can pull that off without losing the "easy setup" identity is the question. The MCP integration is a forward-looking bet too — connecting your dashboard data to conversational AI tools is the kind of feature that sounds gimmicky until it saves you a meeting.
Featured Databox Dashboard Templates
Databox ships with 300+ templates covering marketing, sales, support, and finance use cases. Here are some of the dashboard types we cover across our platform-specific pages — all work with Databox's native connectors:
Browse All Databox Templates →
Frequently Asked Questions
How much does Databox cost in 2026?
Does Databox still have a free plan?
Is Databox good for marketing agencies?
How does Databox compare to Looker Studio?
Does Databox have AI features?
What integrations does Databox support?
What are the biggest complaints about Databox?
The Bottom Line
I started this review thinking Databox was an easy recommendation for in-house teams. And honestly, it still might be — but with more asterisks than I expected. The product itself is genuinely good: fast setup, clean dashboards, the best mobile experience in the category, and a goals/forecasting layer that nobody else in this price range offers. The $20.5M in revenue and 20,000+ customers aren't accidents.
But the free plan removal, the AI paywall at $399/month, and the downward trend in support quality all introduce friction that wasn't there two years ago. The per-source pricing model also means the headline price is almost never the real price. You need to map out your exact data source count — every GA4 property, every ad account, every CRM portal — before the number on the pricing page means anything.
My recommendation: start with the 14-day Growth trial so you can actually test AI summaries and forecasting. Count your real data source needs during the trial. Then decide if Professional ($159) gives you enough, or if you need Growth ($399) for the AI layer. If the math doesn't work, Looker Studio gets you 80% of the dashboard value for free — you just have to do more setup work upfront.
MarketingReports.io may earn a commission if you sign up for Databox through our links. This doesn't affect our editorial independence — the criticisms in this review are sourced from real user feedback and hands-on evaluation. We recommend tools based on fit, not commission rates. See our full disclosure.