- → Whatagraph is purpose-built for agencies that need white-labeled, automated client reporting — it's not trying to be a general BI tool, and that focus is its biggest strength
- → 55+ native integrations with a consistent 30-minute data refresh across all plans — no tiered throttling like some competitors
- → AI summaries and an AI chatbot ship on every plan, not locked behind enterprise tiers (looking at you, Databox)
- → Pricing starts at €199/mo (billed annually) and scales by source credits, not seats — which sounds great until you realize each client's ad account counts as a separate credit
- → Rated 4.4/5 on G2 from 277+ reviews, with consistent praise for customer support speed and visual polish — and consistent complaints about pricing at scale
- → If you're an in-house team with no client reporting needs, you're overpaying — Databox or Looker Studio will serve you better
What Whatagraph Actually Does (and Who It's For)
I'll save you the marketing copy version: Whatagraph is a reporting platform that connects your marketing data sources, lets you build branded report templates, and automates the delivery of those reports to clients on a schedule. PDF, live link, email — whatever cadence your clients expect.
The company was founded in 2015 by three Lithuanian brothers — Justas, Andrius, and Tomas Malinauskas — who relocated to Amsterdam after joining the Rockstart accelerator. The original thesis was simple: agencies waste a ridiculous amount of time formatting reports instead of doing the work those reports are supposed to reflect. That thesis hasn't really changed in eleven years, which is either admirable consistency or a sign they haven't needed to pivot. Probably both.
Here's the thing that matters for choosing the right tool, though: Whatagraph is built for agencies. Not "agencies and also enterprise teams and also freelancers and also anyone with a pulse." Agencies. The entire product — white-labeling, multi-client management, custom domains on reports, scheduled delivery to external stakeholders — assumes you're managing campaigns for someone else and need to show them results on a regular cadence.
If you're an in-house marketing team at a single company? You'll be paying for a layer of features — client management, white-labeling, external delivery schedules — that you'll literally never open. Tools like Databox or even the free version of Looker Studio will stretch further for internal KPI dashboards.
I keep coming back to this question when evaluating reporting tools: does it actually save time, or does it just move the time around? With Whatagraph, the answer is genuinely the former — for agencies. Multiple G2 reviewers in early 2025 reported saving 70%+ of their billable reporting hours after onboarding. One agency owner mentioned they onboarded two new clients with the time they freed up. That's not a marginal efficiency gain. But it depends entirely on your use case fitting the mold.
Features That Actually Matter (Not the Marketing Bullet List)
Every reporting tool's feature page reads more or less the same — "connect your data, build beautiful reports, automate everything." I want to focus on what specifically differentiates Whatagraph from the dozen other tools making those exact claims.
White-Labeling That Goes Beyond Logo Swaps
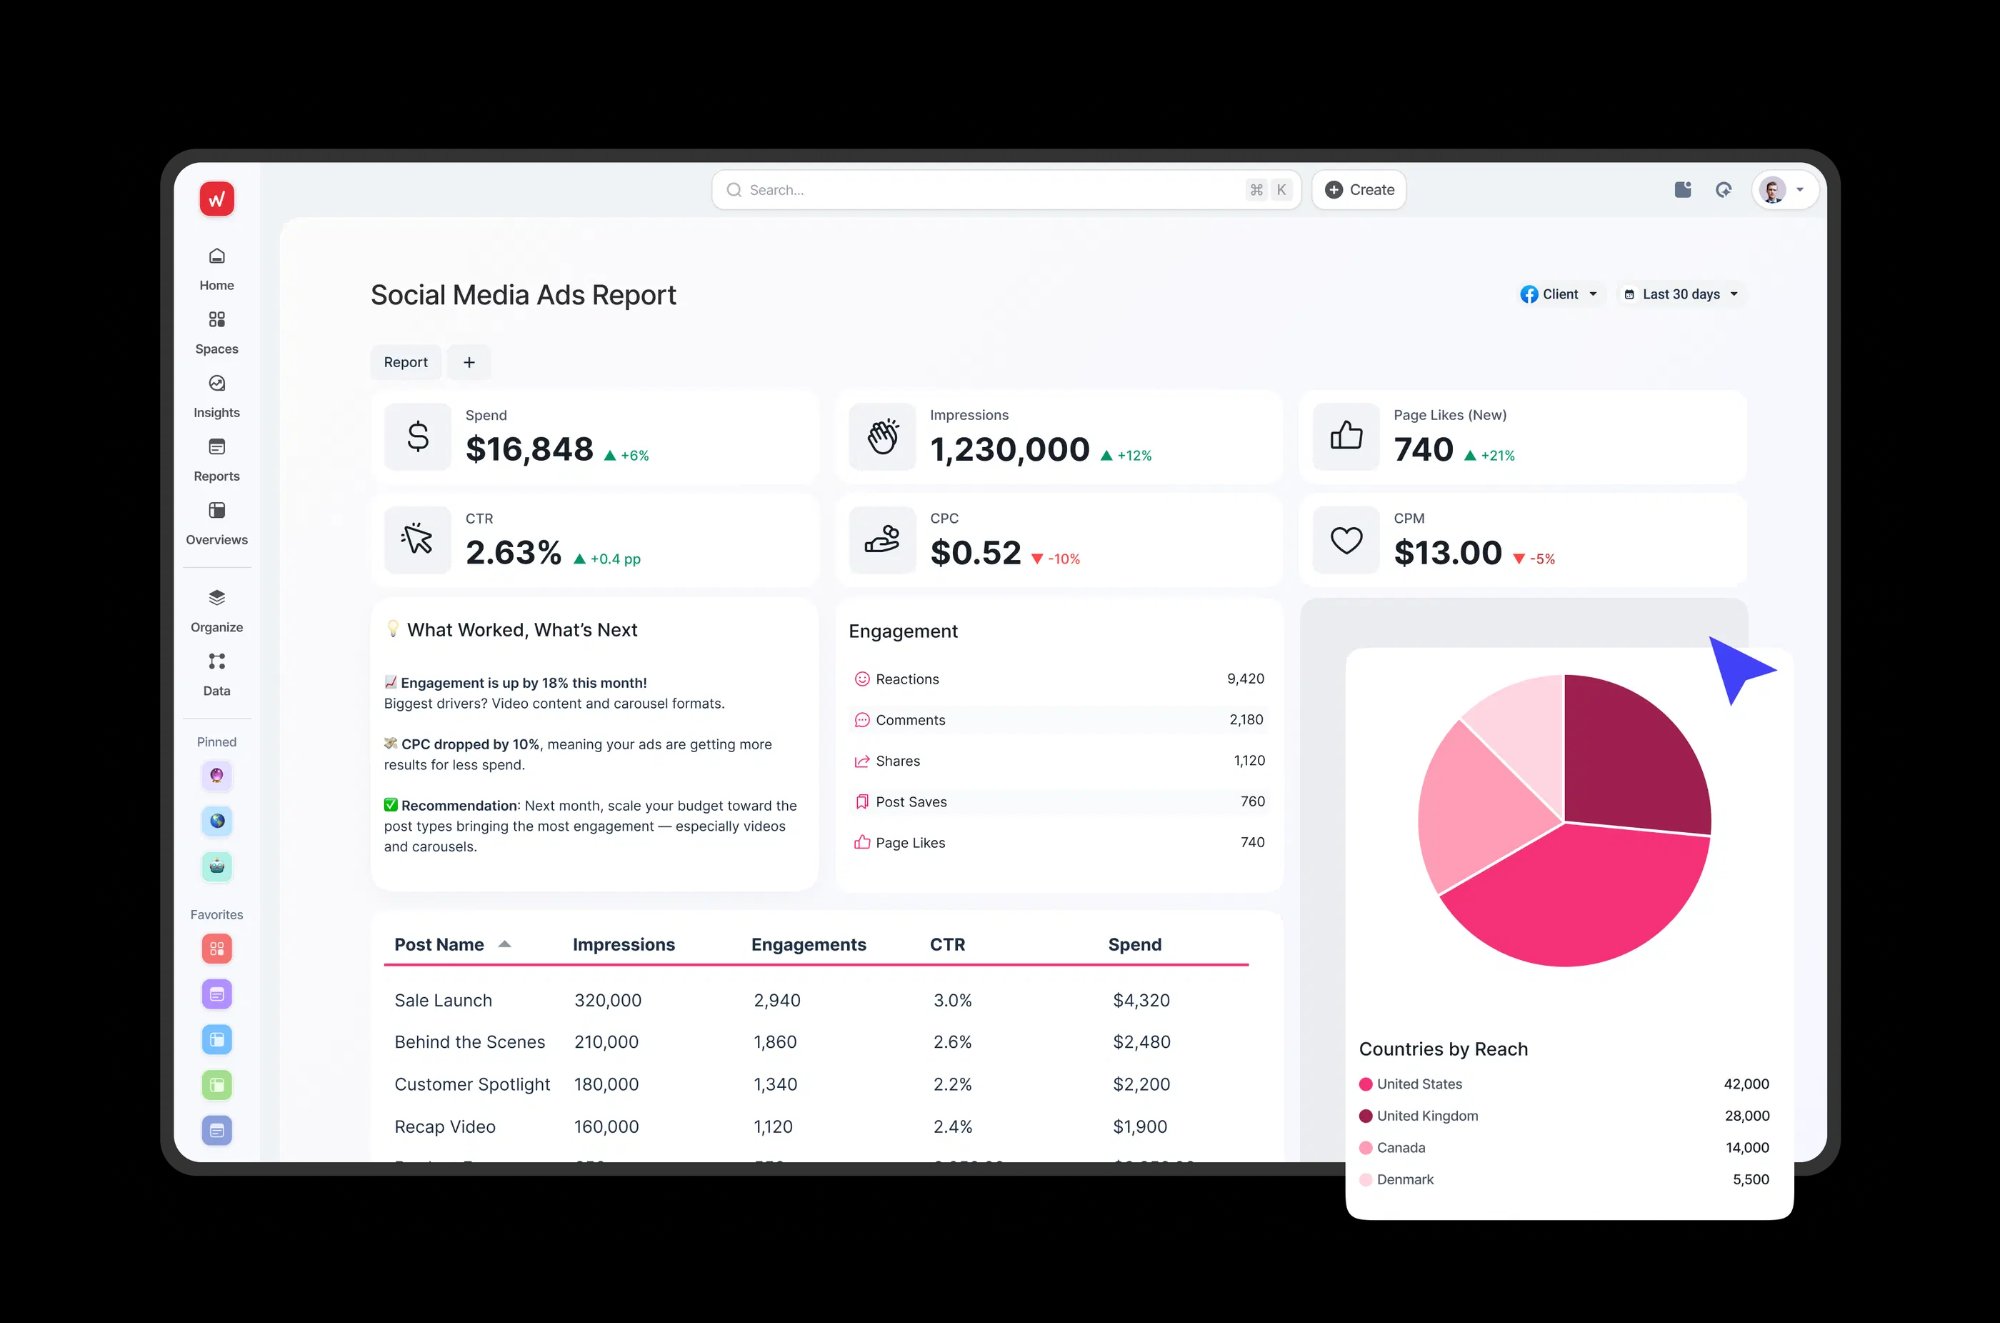
Most competitors offer some version of "add your logo." Whatagraph pushes this further. You get custom domains for report access (so your client sees reports.youragency.com, not app.whatagraph.com), full color theming, custom widget titles and descriptions, and the ability to rename metrics at the report level. One G2 reviewer described the reports as feeling like an extension of their own brand rather than a third-party tool.
Actually, that's not quite right — it's not that other tools can't do some of this. AgencyAnalytics has decent white-labeling too. The difference is Whatagraph bundles the custom domain feature on every paid plan. With AgencyAnalytics, you'll need a higher tier for that. Small distinction, but it adds up when you're comparing annual costs.
AI Summaries and the AI Chatbot
Whatagraph launched AI-generated summaries in January 2025 — auto-generated plain-language performance narratives in 18 languages. The more interesting piece is the AI chatbot, which can actually interrogate your data. You ask it a question about campaign performance, and it pulls specific metrics, highlights trends, and surfaces answers without you opening ten separate reports.
What I find genuinely strange is that both AI features ship on every plan. Databox gates its AI summaries behind the Growth tier ($319+/month). Whatagraph just… includes them. For a premium-priced product, they're not using AI as an upsell lever, which is refreshing. Whether the AI output is actually good enough to ship directly to clients without editing is another question — I'd recommend treating the summaries as first drafts, not final copy.
55+ Native Integrations with a Flat 30-Minute Refresh
The integration count (55+) is solid for the agency use case, even if it's smaller than Supermetrics' 130+ or Funnel.io's 500+. The meaningful distinction is that these are all first-party connectors built and maintained by Whatagraph's own engineering team — no third-party middleware that breaks when an API updates.
The 30-minute data refresh rate applies across all plans and all integrations. Some competitors (Klipfolio, for example) throttle refresh speed by pricing tier — you get hourly on the cheap plan, faster on premium. Whatagraph doesn't play that game, which removes one variable from the "which plan do I actually need" calculation.
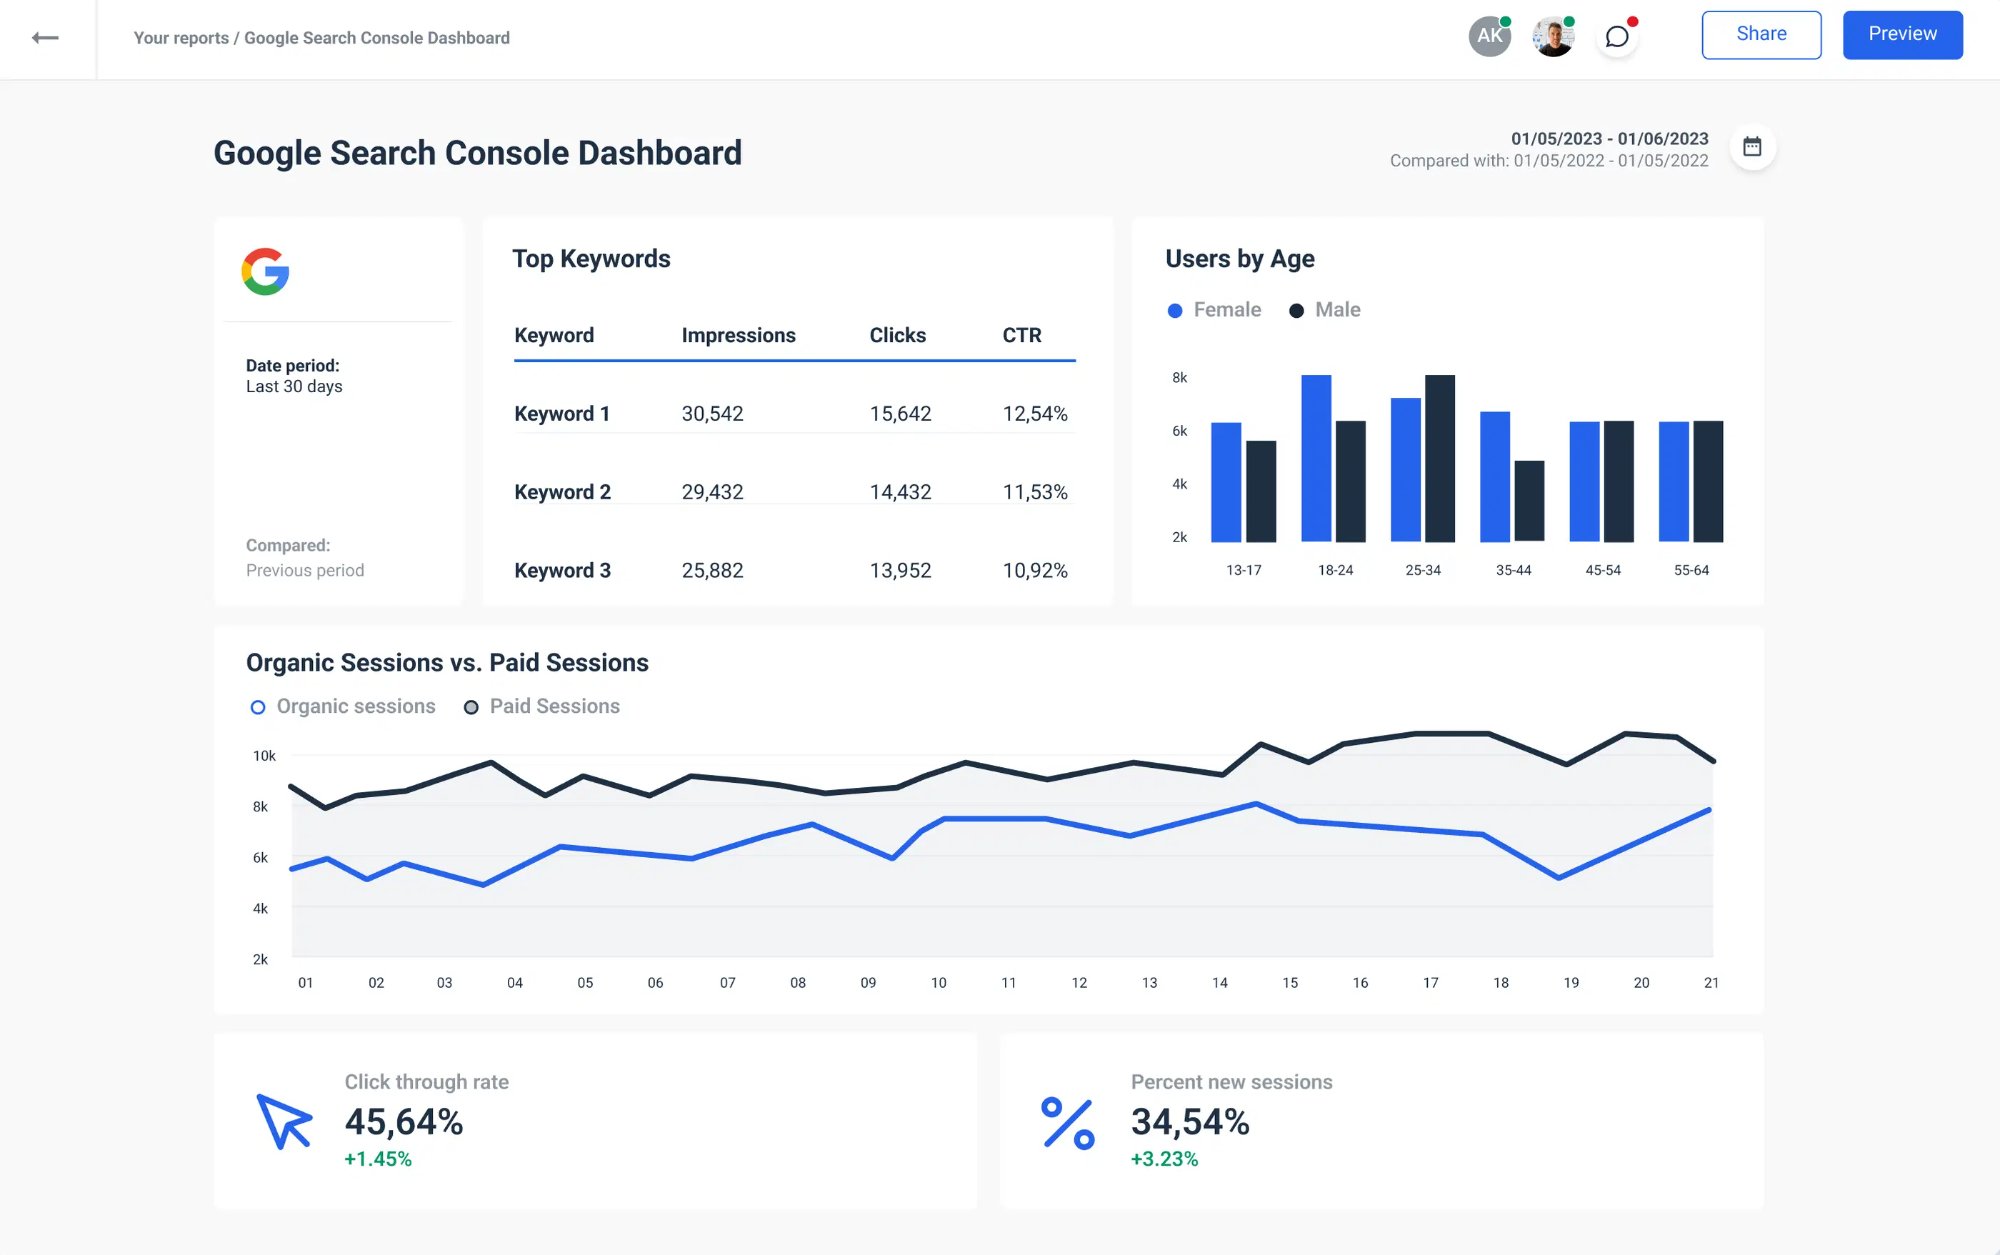
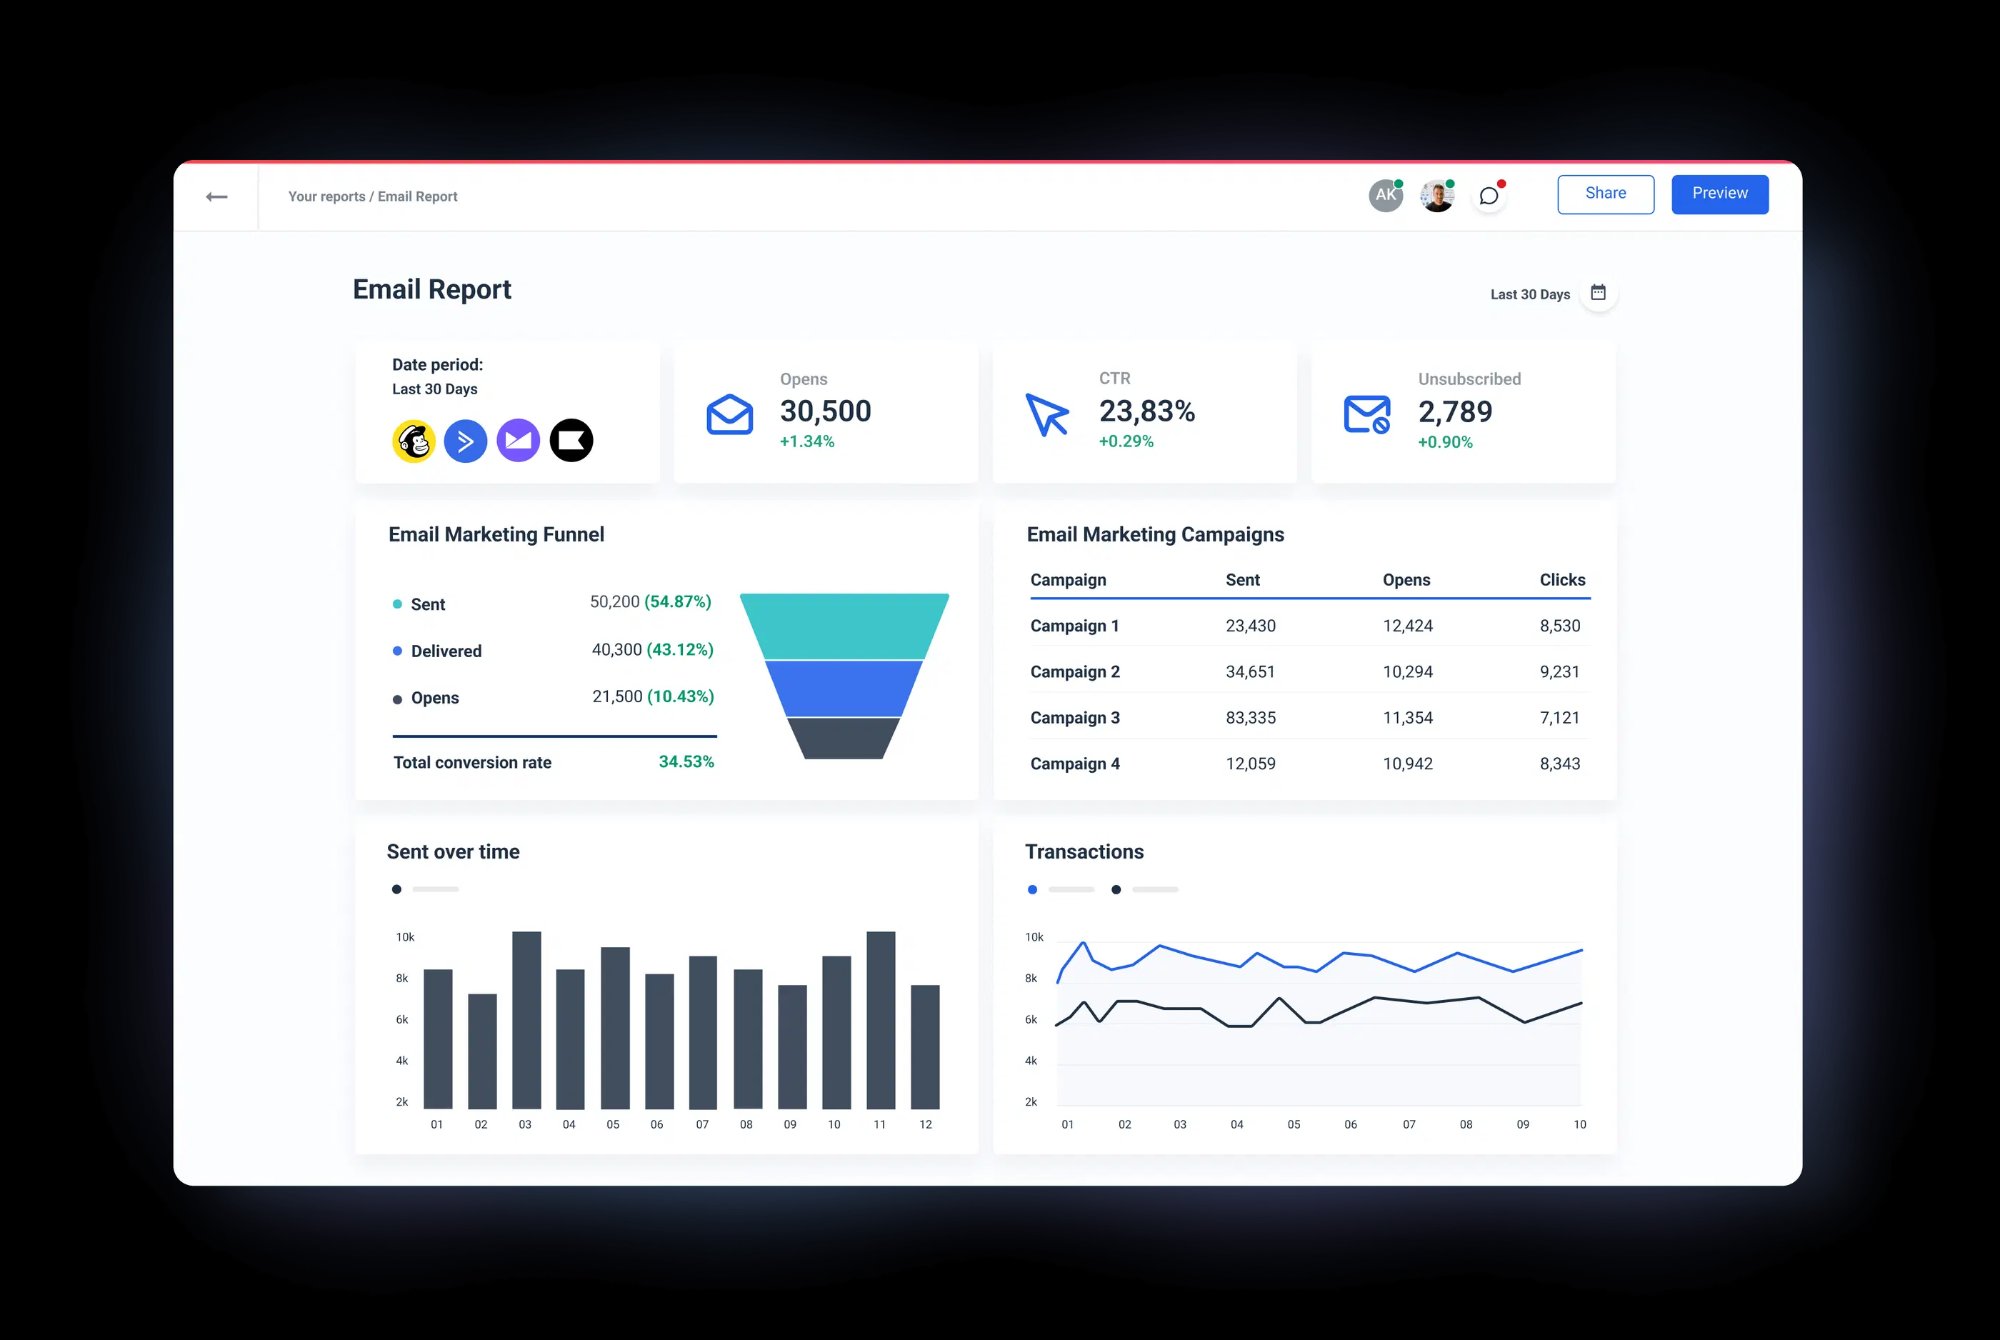
What's covered: Google Ads, Meta Ads, LinkedIn Ads, TikTok, Pinterest, Snapchat, Google Analytics 4, Google Search Console, Ahrefs, Semrush, Shopify, BigCommerce, Mailchimp, Klaviyo, HubSpot, Salesforce, CallRail, and more. What's notably missing: X Ads (Twitter) was still unsupported as of recent G2 reviews, which is a legitimate gap if your clients run paid Twitter campaigns.
Report Templates and the Drag-and-Drop Builder
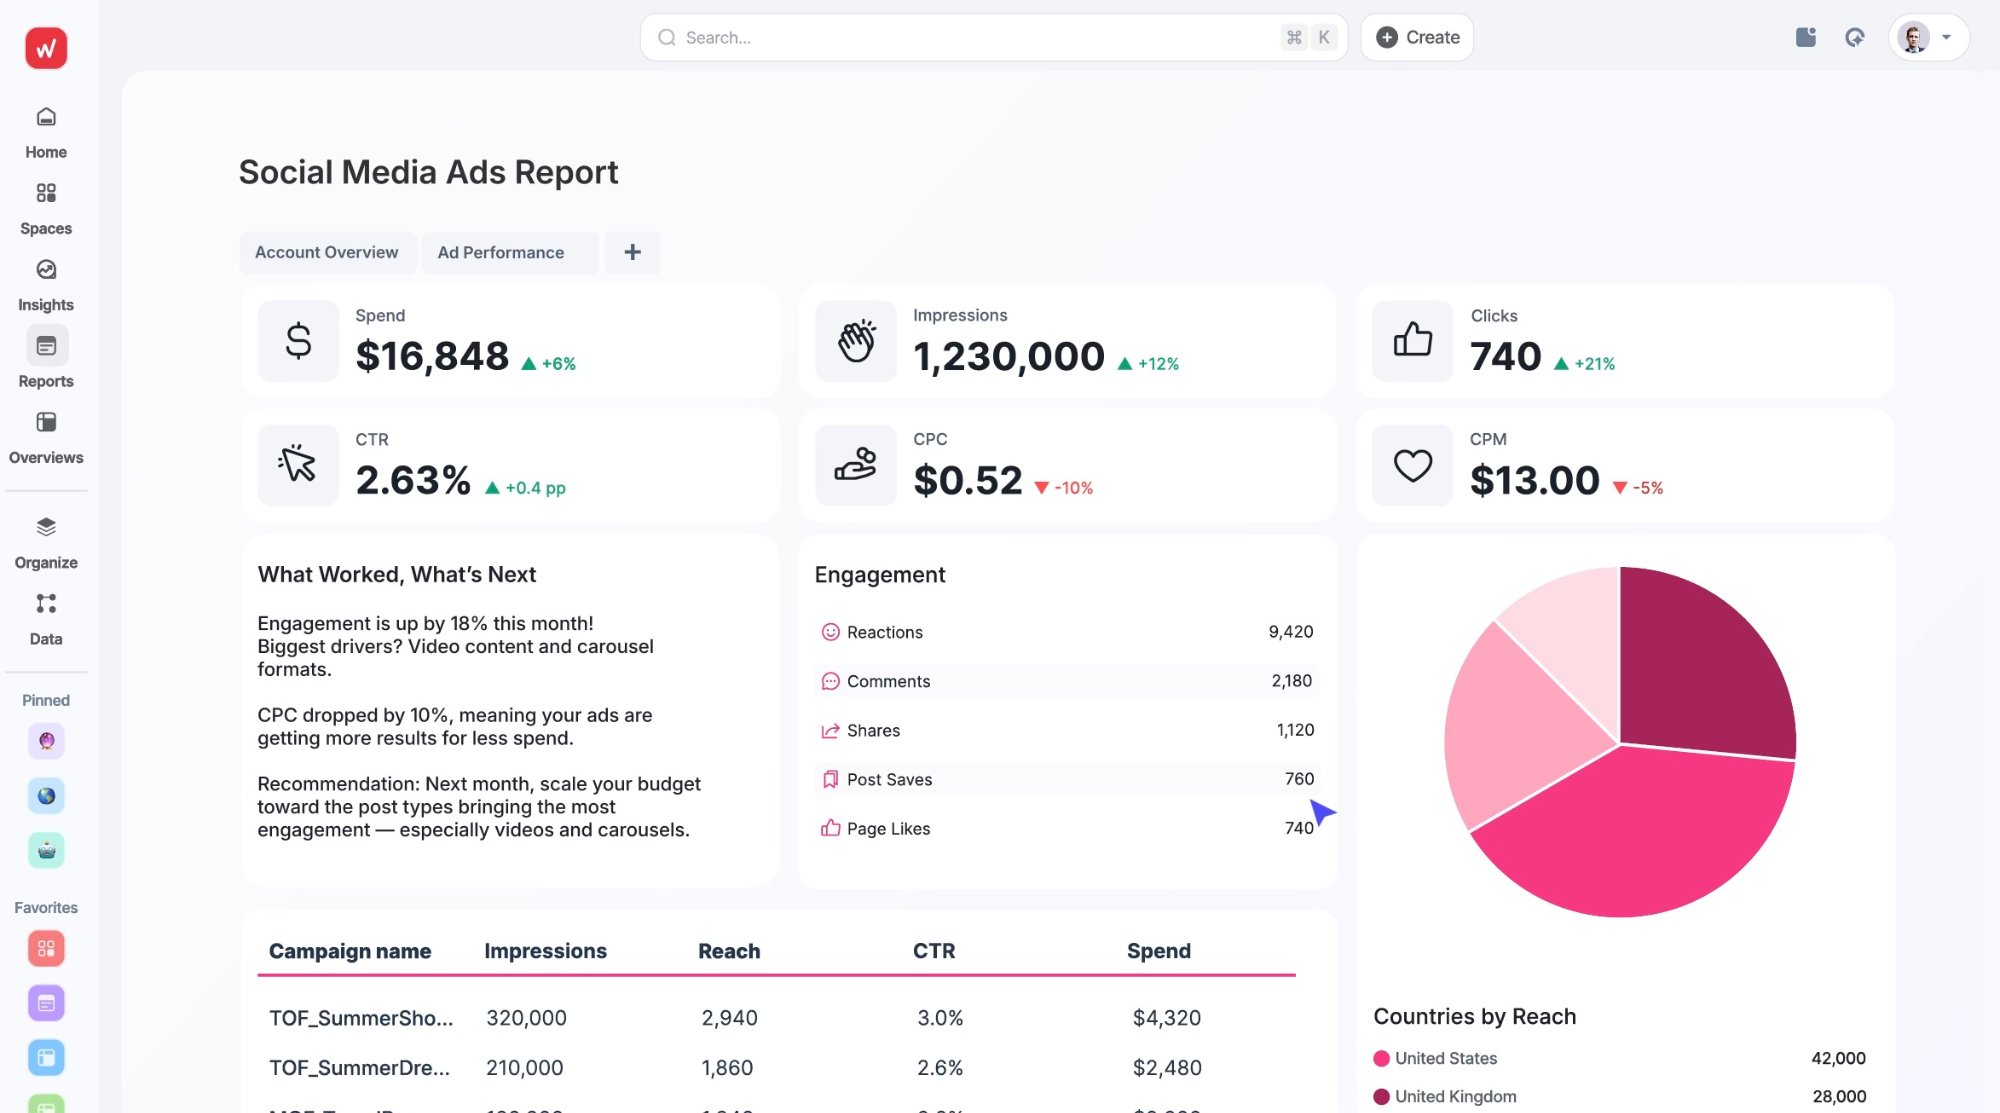
Whatagraph includes 100+ customizable report templates and a visual builder with 15+ widget types — gauges, stacked columns, pie charts, funnel visualizations, multi-source tables. You can save your own widget configurations as reusable building blocks and save entire report templates to deploy across new clients without rebuilding from scratch.
The builder is genuine drag-and-drop, not the "drag-and-drop but everything snaps to a rigid grid and you can't overlap anything" kind you get with some tools. That said, a few Capterra reviewers have flagged that layout customization still has limits — you can't achieve pixel-level control, and some widget sizing constraints can feel rigid when you're trying to build something highly bespoke.
Where Whatagraph Falls Short (The Part They Won't Put on the Homepage)
I don't trust tool reviews that don't include real criticism. Here's what keeps coming up across G2, Capterra, and conversations with agency owners who've used Whatagraph at scale:
Credit-Based Pricing Gets Expensive Fast
The pricing model charges by "source credits" — each connected data account counts as one credit. The Start plan includes 20 credits. Sounds like plenty until you map it out: a single client with Google Ads, Meta Ads, GA4, and Google Search Console is already 4 credits. Five clients = 20 credits = you've maxed out the cheapest plan and need Boost (50 credits) at €399/month (billed annually). This math escalates quickly for agencies managing 15+ clients with multi-channel campaigns.
"The price is the thing I like the least — it's not cheap."Márcio D., verified G2 reviewer (June 2024)
Co-Editing Gets Glitchy
If two people are editing the same report at the same time, widgets can glitch or break. G2's satisfaction score for co-editing is 83% — not terrible, but this is the kind of bug that hits hardest on deadline day when you really don't need it. One reviewer described losing widget settings during a simultaneous edit session. For agencies with multiple people touching the same templates, this is a real workflow friction point.
Data Connector Disconnections
This comes up repeatedly across review platforms: connectors occasionally disconnect without warning, requiring manual reconnection. When it happens right before a scheduled client delivery, it's more than an inconvenience — it's a client trust issue. Whatagraph's support team is consistently praised for fast response times (under 3 minutes via live chat), so the fix is usually quick, but the fact that it happens at all is worth knowing.
Limited Advanced Data Transformation
Whatagraph supports basic data blending — combining metrics from different sources in the same widget. But if you need custom calculated fields across sources (like comparing cost-per-lead between Facebook and Google Ads in a single unified metric), advanced data modeling, or long-term historical data storage, you'll hit walls. This isn't a full ETL tool. If you're coming from a data engineering background expecting Fivetran-level flexibility, recalibrate your expectations.
Whatagraph Pricing in 2026: What You'll Actually Pay
Whatagraph has three paid tiers plus a free plan, all billed in euros. The main cost driver is source credits — not user seats or report volume. All plans include unlimited users and unlimited reports, which is genuinely unusual in this space.
- 5 source credits
- Unlimited users
- Essential integrations only
- Limited templates
- No custom domain
- 20 source credits
- Unlimited users & reports
- Essential integrations
- AI summaries + chatbot
- White-labeling
- Dedicated CSM
- 50 source credits
- Everything in Start
- Advanced integrations
- Priority support
- Custom onboarding
- Unlimited credits
- Everything in Boost
- Premium integrations
- Dedicated CSM + onboarding
- Custom data pipelines
The thing that trips people up: annual billing is the standard listed price on their site. Monthly billing is available at higher rates, but Whatagraph also runs a sales-led model for higher tiers. You can't just click "buy" on the Max plan — you'll talk to a sales rep, get a proof-of-concept, and negotiate. Enterprise contracts can run €7,500+/year for 50 connections, scaling to $10K+ for 100+.
My honest take on pricing: for an agency managing 5–8 clients with straightforward reporting needs, the Start plan is workable. For larger agencies with 15+ clients and multi-channel campaigns, you're looking at Boost or Max, and you should run the credit math before committing. The per-credit model can feel punishing if your clients use a lot of ad platforms.
What 370+ Real Users Say: Aggregated Review Data
I pulled the latest public ratings from every major review platform that covers Whatagraph. Here's the aggregate picture as of early 2026:
What Reviewers Consistently Praise
Customer support speed is far and away the most mentioned positive. Multiple G2 reviewers in 2025 reported getting live chat responses in under 3 minutes, with most issues resolved same-day. Every paid plan includes a dedicated Customer Success Manager — a real differentiator when competitors gate CSM access behind premium tiers.
Visual quality of reports comes up constantly. Reviewers describe the output as client-ready without needing to clean up charts or reformat. One user described it as "the Tesla of digital analytics tools" for its visual presentation — a little hyperbolic, but the sentiment shows up frequently enough to be real.
Time savings are the bottom-line metric that matters. Across multiple reviews, agencies report cutting manual reporting time by 60–70%. Several mentioned that they stopped using Google Data Studio entirely after switching.
What Reviewers Consistently Criticize
Pricing at scale is the single most common complaint. The credit-based model makes budgeting tricky for growing agencies. More than a few reviews mention sticker shock when doing the math on what a 15+ client roster actually costs.
Occasional data mismatches between what Whatagraph displays and what the source platform shows. This seems to happen most when APIs update and Whatagraph's connectors need a few hours to catch up. Not catastrophic, but it shakes confidence if you notice it before a client does.
Limited customization for power users. If you're the type who wants pixel-level control over every widget dimension and position, you'll feel constrained. Capterra gives Whatagraph a 3.5 out of 5 on customizable reports — and that lines up with the qualitative feedback.
Whatagraph vs. the Alternatives: A Straight Comparison
I've gone back and forth on which tools to include here. These are the four that agencies most frequently evaluate alongside Whatagraph, based on the conversations I've had and the comparison searches I see in our analytics:
| Feature | Whatagraph | Databox | Looker Studio | Klipfolio |
|---|---|---|---|---|
| Best for | Agencies | In-house / SMB | Google-stack teams | Technical marketers |
| White-labeling | ✓ Full (incl. custom domain) | ✗ | ✗ | ✓ (higher tiers) |
| AI features | ✓ All plans | Growth+ only | ✗ | ✗ |
| Integrations | 55+ native | 100+ | 1,050+ (via connectors) | 100+ |
| Data refresh | 30 min (all plans) | Hourly–4hr (varies) | Real-time (Google native) | Varies by plan |
| Automated PDF | ✓ | ✓ | ✗ | ✓ |
| Free plan | 5 credits | ✓ (3 sources) | ✓ Fully free | Free tier |
| Starting price | €199/mo (annual) | $72/mo | Free | ~$125/mo |
| Dedicated CSM | ✓ All plans | Premium only | ✗ | Enterprise only |
Look — if budget is the primary constraint and you're comfortable with more manual setup, Looker Studio is free and incredibly capable for teams living in the Google ecosystem. If you're an in-house team wanting KPI dashboards with mobile access, Databox is better suited and cheaper. But if you're running an agency with 5+ clients who expect branded, automated reports delivered on schedule? That's exactly the use case Whatagraph was built for, and it does it well enough that their customers stick around.
Who Should Actually Use Whatagraph
It's a strong fit if:
- You're a marketing agency managing recurring client reports across multiple channels
- White-labeling matters — your clients see your brand, not a third-party tool
- You need automated report delivery (PDF or live links) on a weekly or monthly schedule
- Your data sources are mainstream ad platforms, analytics, and CRMs (the 55+ connector list covers most agency needs)
- You want AI-generated performance summaries without paying for an enterprise tier
It's probably not the right tool if:
- You're an in-house team with no external reporting needs — you'll overpay for agency features you never use
- You need 100+ integrations or deeply niche connectors — Supermetrics or Funnel.io have broader libraries
- You want pixel-level report customization or advanced data modeling — Whatagraph isn't a BI tool
- You're on a tight budget managing fewer than 3 clients — the credit math doesn't pencil out below a certain scale
- Your clients are exclusively on X (Twitter) Ads — still no native connector as of early 2026
Recent Product Updates (2025–2026)
Whatagraph has been shipping consistently. Here's what's actually changed since early 2025:
- AI Summaries (January 2025) — auto-generated performance narratives in 18 languages, included on all plans
- AI Chatbot — conversational data querying that pulls specific metrics and trends from your connected sources
- Goals tracking — set per-metric targets and show clients their progress toward KPIs visually
- Improved GA4 connector — full event-based data model support, addressing earlier gaps from the Universal Analytics migration
- Free plan launch — 5 credits at no cost, giving small agencies or freelancers a way to test the platform without a sales call
- Integration tiers — integrations now split into Essential, Advanced, and Premium levels across plans, making it clearer what's included at each price point
The pace here is encouraging. The AI features in particular feel like a meaningful product investment, not a checkbox feature shipped for marketing purposes. The chatbot especially — being able to ask natural-language questions about your data and get metric-specific answers is genuinely more useful than a generic AI summary widget that just spits out a paragraph nobody reads.
Featured Whatagraph Dashboard Templates
One of Whatagraph's practical advantages is its template library. Instead of building reports from a blank canvas, you start with pre-built templates for common reporting scenarios and customize from there. Here are some of the dashboard types we cover across our platform-specific template pages — all available to agencies using Whatagraph:
Browse All Whatagraph Templates →
Frequently Asked Questions
How much does Whatagraph cost in 2026?
Does Whatagraph have a free trial?
Is Whatagraph worth it for a small agency with fewer than 5 clients?
How does Whatagraph compare to AgencyAnalytics?
Can I use Whatagraph for internal team dashboards (not client reporting)?
What integrations does Whatagraph support?
What are the biggest complaints about Whatagraph?
The Bottom Line
I've been going back and forth on how to frame this, and here's where I landed: Whatagraph is a focused, well-executed product for a specific use case. It doesn't try to be everything. It doesn't pretend to compete with full BI suites or enterprise data pipelines. It does one thing — automated agency reporting — and it does it with enough polish, enough AI smarts, and enough support infrastructure that agencies who fit the profile tend to stay.
The pricing will be a non-starter for some, and that's fine. The co-editing bugs and occasional connector drops are real irritants. But if your agency is spending 10+ hours a week on manual report assembly and you're ready to trade that time for a subscription that handles it automatically? Whatagraph deserves a serious look.
Start with the free plan to test the interface, then do the credit math with your actual client roster before committing to a paid tier.
MarketingReports.io may earn a commission if you sign up for Whatagraph through our links. This doesn't affect our editorial independence — the criticisms in this review are based on real user feedback and hands-on evaluation. We recommend tools based on fit, not commission rates. See our full disclosure.